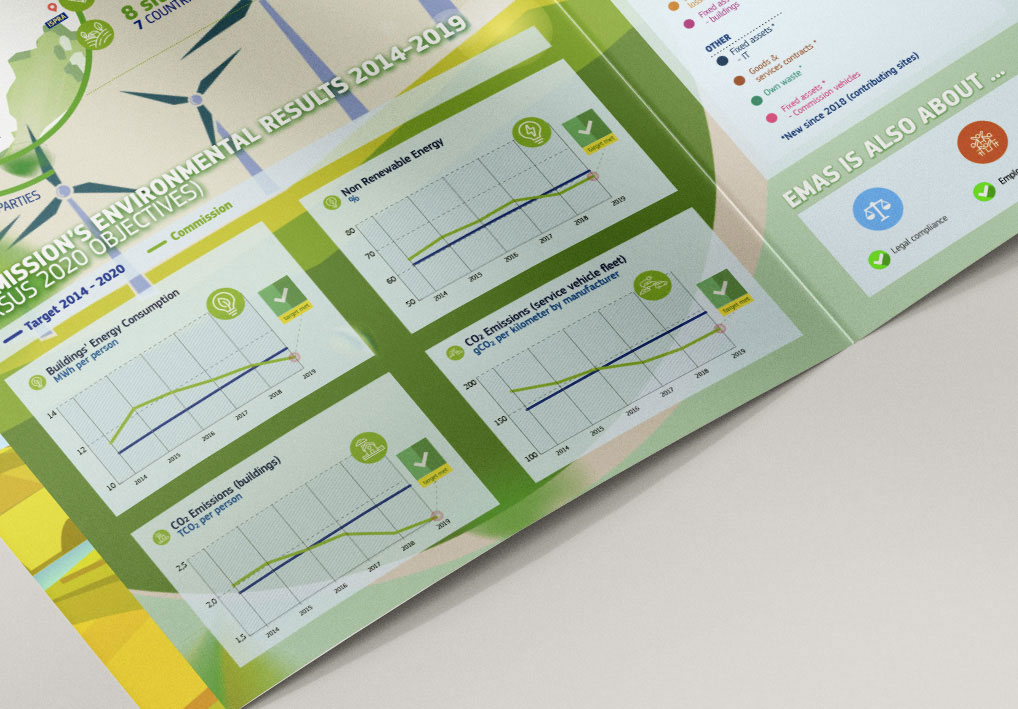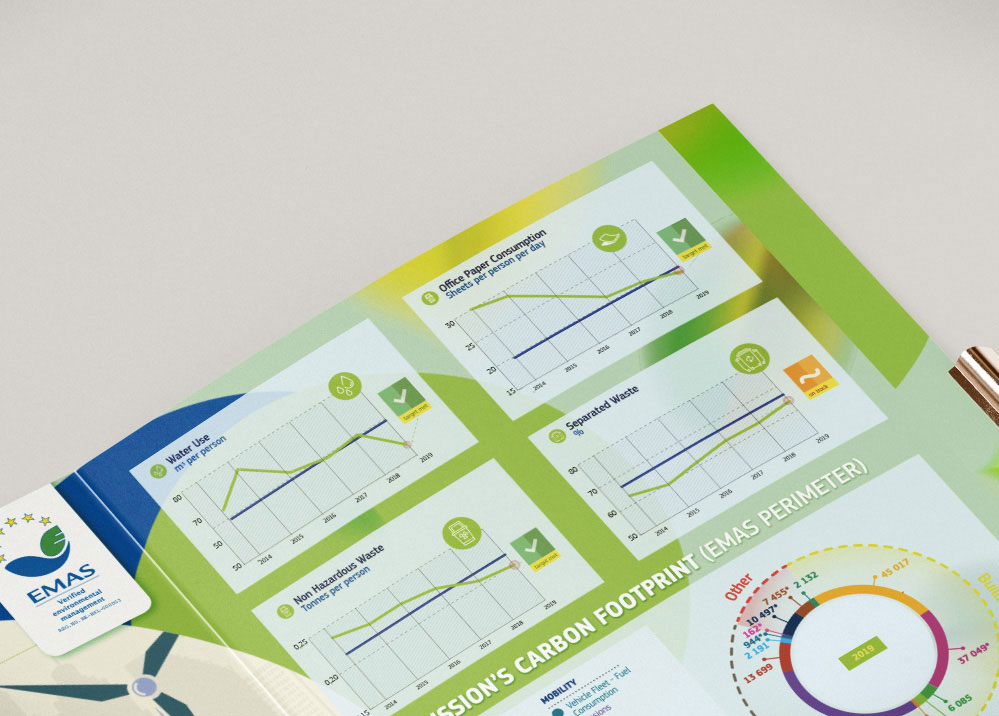
EMAS data visualisation
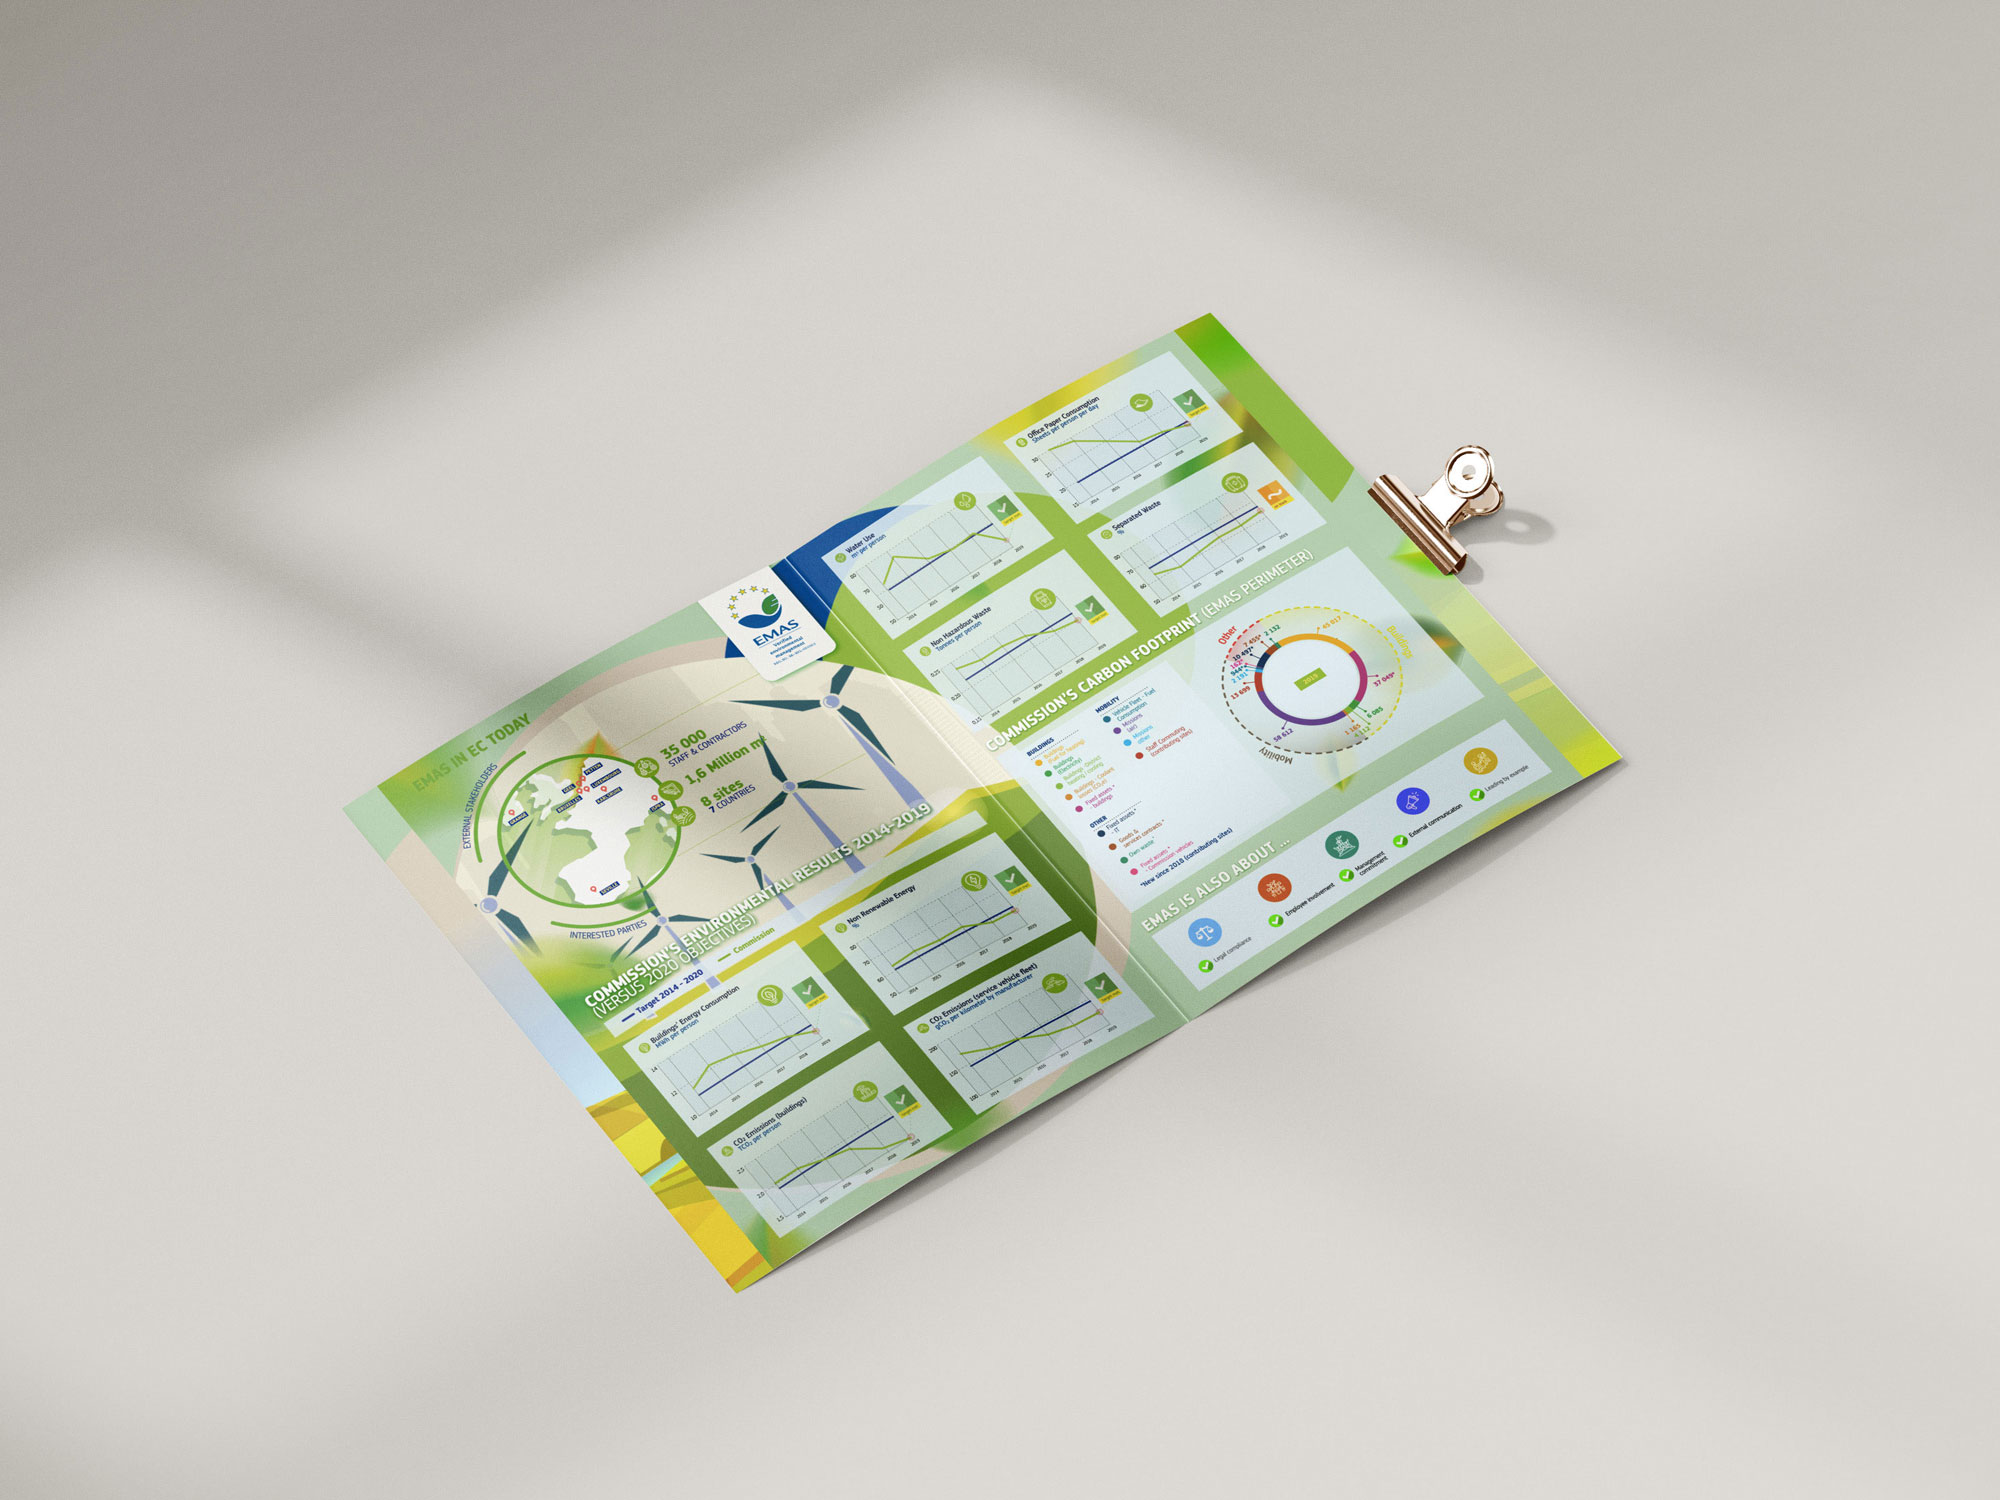
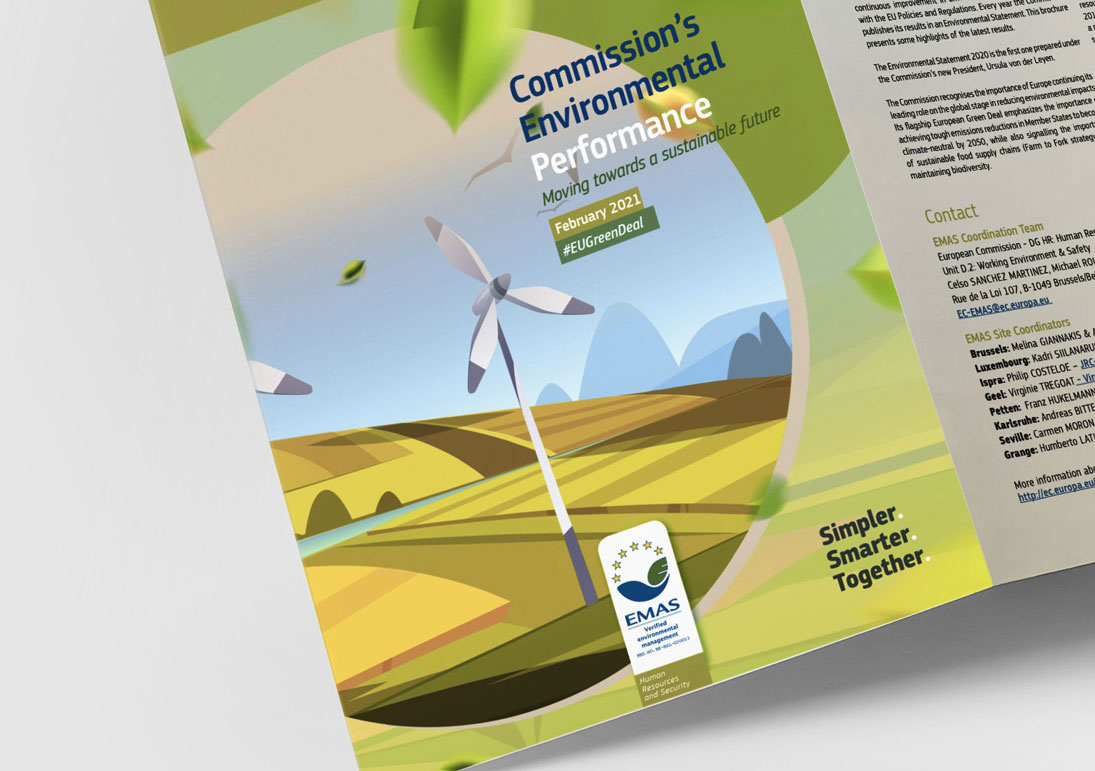
Design of annual report, with data visualisation, on European Commission's Environmental Performances about EMAS guidance and objectives.
EMAS is open to every type of organisation eager to improve its environmental performance. It spans all economic and service sectors and is applicable worldwide.
Data visualisation
Graphs, KPIs
Graphic Design
Colorimetry, styling
Layout
Case study
To communicate to the European Commission's staff, about the environmental performance of the organisation, an annual corporate report was showcasing the performances and rates obtained, in regards of some target goals agreed by the organisation with EMAS internal services. The document was visualy communicating these annual trends and results.